Vocabulary
Quadratic Inequality with Two Variables- An inequality that can be written in the form y<ax²+bx+c, y≤ax²+bx+c, y>ax²+bx+c, or y≥ax²+bx+c. The graph for any such inequality consists of all real solutions (x,y) of the inequality.
Quadratic Inequality with One variable- An inequality that can be written in the form ax²+bx+c<0, ax²+bx+c≤0, ax²+bx+c>0, or ax²+bx+c≥0. Can be solved through tables, graphs, or algebraic methods.
Quadratic Inequality with One variable- An inequality that can be written in the form ax²+bx+c<0, ax²+bx+c≤0, ax²+bx+c>0, or ax²+bx+c≥0. Can be solved through tables, graphs, or algebraic methods.
Essential Information
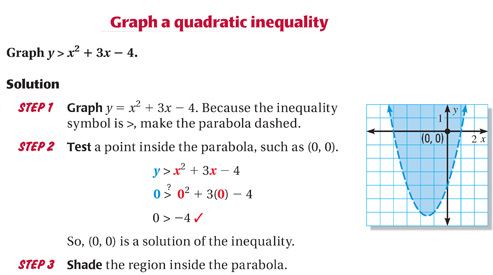
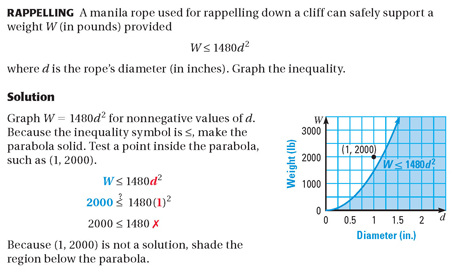
Graph a Quadratic Inequality with Two Variables
- Graph the parabola with the equation y=ax²+bx+c. Make the parabola dashed for inequalities with < or > and solid for inequalities with ≤ or ≥.
- Test a point (x,y) that is not on the parabola itself to determine whether the point is a solution of the inequality.
- Shade the region that the point was in if the point from step two was a solution, and the other region if the point was not a solution.
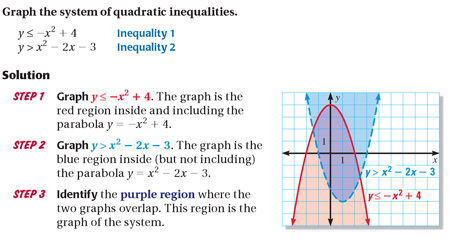
Systems of Quadratic Inequalities
Graphing a system of quadratic inequalities is similar to graphing a system of linear inequalities. First graph each inequality in the system. Then identify the region in the coordinate plane common to all of the graphs. This region is called the graph of the system.
Graphing a system of quadratic inequalities is similar to graphing a system of linear inequalities. First graph each inequality in the system. Then identify the region in the coordinate plane common to all of the graphs. This region is called the graph of the system.
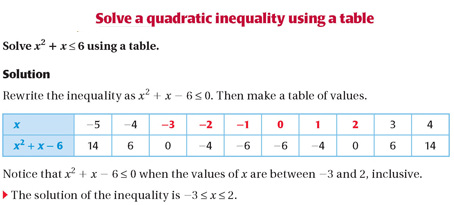
One Variable Inequalities
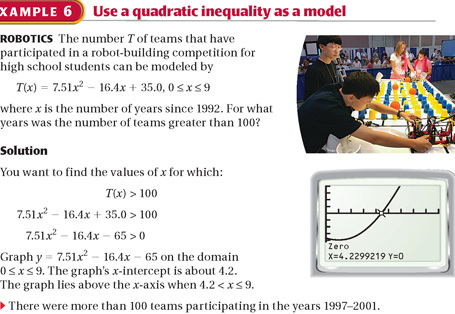
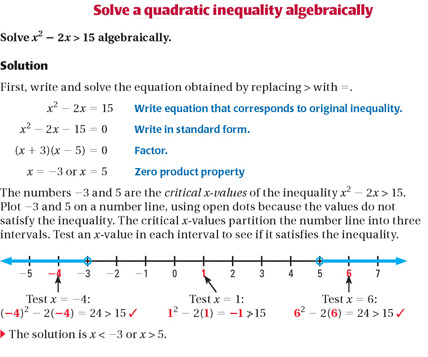
One Variable Inequalities can be solved using tables, graphs, or algebraic methods.
One Variable Inequalities can be solved using tables, graphs, or algebraic methods.
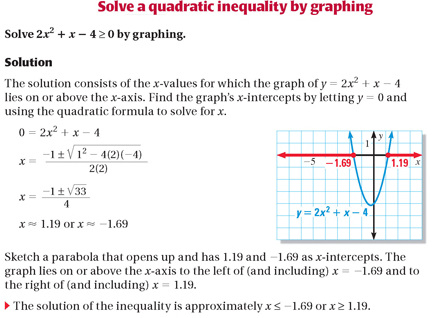
Graphing to Solve Inequalities
Another way to solve ax²+bx+c<0 is to first graph the related function y=ax²+bx+c. Then, because the inequality symbol is <, identify the x-values for which the graph lies below the x-axis. A similar procedure can be used to solve quadratic inequalities that involve ≤, >, or ≥.
Another way to solve ax²+bx+c<0 is to first graph the related function y=ax²+bx+c. Then, because the inequality symbol is <, identify the x-values for which the graph lies below the x-axis. A similar procedure can be used to solve quadratic inequalities that involve ≤, >, or ≥.